Featured Resources
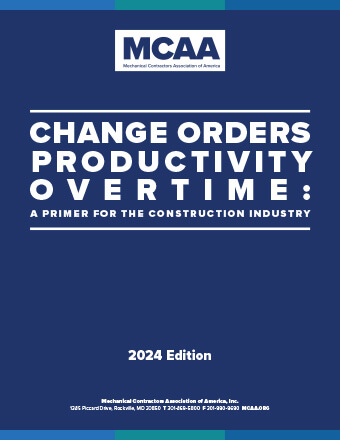
Change Orders, Productivity, Overtime—A Primer for the Construction Industry
This planning tool helps you determine the costs associated with unplanned events, circumstances and factors that may impact the outcome, productivity and schedule of construction projects. New for 2024: a chapter exploring the factors that contribute to BIM cost and time overruns.
Mental Health Awareness & Suicide Prevention Video
Our newest safety and health video highlights the success story of an industry veteran, with appearances from MCAA’s president Robert Beck, the UA’s Jen Massey, industry expert Dr. Sally Spencer Thomas, and MCAA member Ricky Reams.
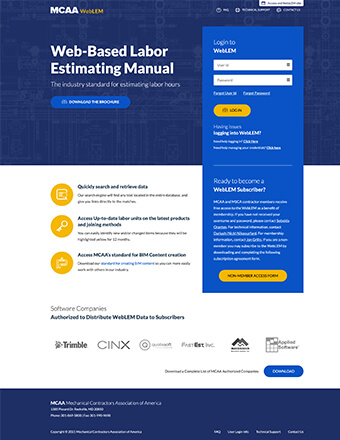
WebLEM is the industry’s most reliable authority for comprehensive labor units for typical project tasks. Quickly search for and retrieve information. WebLEM is reviewed and updated to reflect the latest products and joining methods. You will need your MCAA.org username and password to log in to WebLEM. For WebLEM access questions, please refer to the WebLEM Access FAQs page.
National Service and Maintenance Agreement
The National Service and Maintenance Agreement is an agreement negotiated and administered by the United Association of Journeymen and Apprentices of the Plumbing and Pipefitting Industry (UA) and the Mechanical Service Contractors of America (MSCA) and is a signed contract between the UA and individual mechanical service contracting firms who apply and qualify. The Agreement is a nationally recognized tool that helps contractors provide quality, consistent service to their customers throughout the country and helps reclaim lost market share.
NIBCO INC. unveiled the Rex Martin NIBCO Interactive Museum on November 12, 2024, coinciding with NIBCO’s 120th anniversary. The museum offers a unique and enriching experience from a historical perspective, interactive learning, inspiration, community impact, and career opportunities. Not just a place to learn about the past, it’s a place to get excited about the future of plumbing and the opportunities it holds. NIBCO INC. is a major sponsor of MCAA25.
Jennifer Tartaglia is a Mechanical Engineering major at the University of Maryland, College Park and is anticipated to graduate this spring. She has been an active member of her student chapter for the past two years and currently serves as the UMD Student Chapter President. Last summer, Jennifer interned with MCAA Member, Harris.
Field leaders looking to enhance their leadership skills and industry knowledge will benefit from MCAA’s May Field Leaders Conference, being held Monday, May 12 – Wednesday, May 14 at the Hilton Washington DC National Mall The Wharf. The event is nearing full capacity. Don’t miss this opportunity to register your field leaders today!
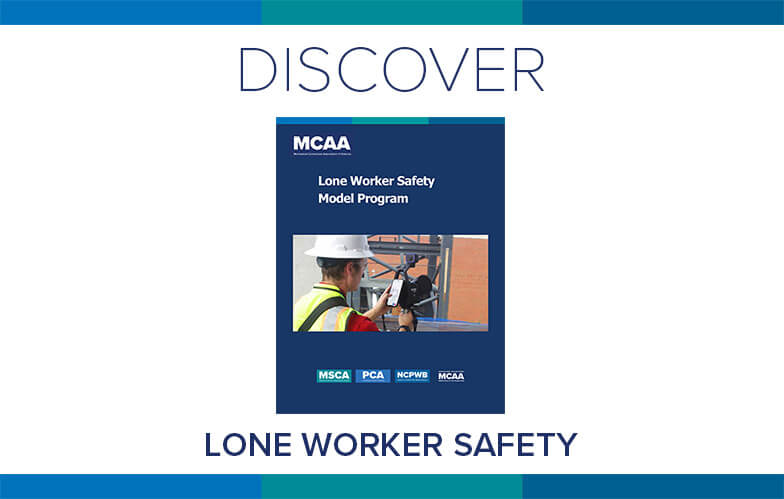
Service technicians may work on their own without ready access to assistance. MCAA’s Lone Worker Safety Model Program helps contractors identify risks and hazards and ensure adequate systems are in place to protect those workers. It’s just one of MCAA’s educational resources that are free to MCAA members as a benefit of membership.
MCAA has joined forces with the National Fire Protection Association (NFPA) to offer resources and tools customized and curated to specifically address and mitigate risks related to electrical safety posed to MCAA members, including physical, compliance and financial risks. Crafted by NFPA’s trusted subject matter experts, this content will provide actionable information and strategies to help you and your team keep pace with the ever-changing regulatory environment, identify potential hazards and shortfalls, and markedly improve safety for your employees, customers, and their workplaces and communities.
The Manufacturer/Supplier Training area of MCAA’s website connects our contractor members with training opportunities available from the members of MCAA’s Manufacturer/Supplier Council.
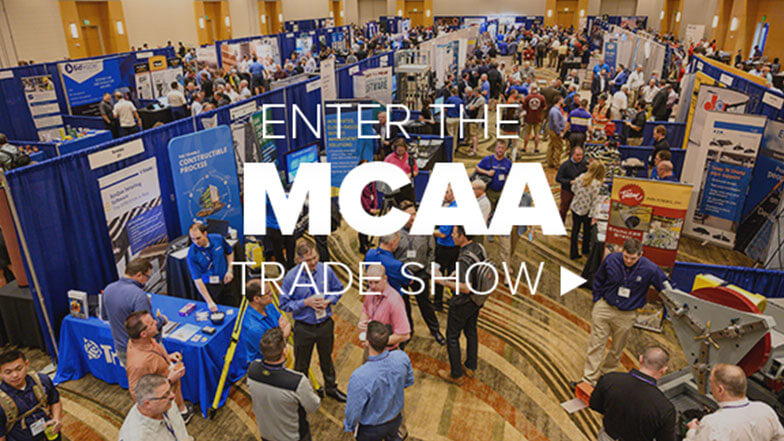
MCAA’s Virtual Trade Show connects our contractor members with the members of MCAA’s Manufacturer/Supplier Council.
Switching from manual hoists to MILWAUKEE TOOL’s M18™ Compact 1-Ton Chain Hoist with ONE-KEY™, Hooper Corporation minimized the physical demands on its workers while making installation much easier and decreasing downtime. Using a cordless chain hoist takes less time to set up and also allows Hooper’s team to get into more tight spaces, increasing efficiency overall. MILWAUKEE TOOL is a benefactor of MCAA25.
Registration is now open for MCAA’s May Field Leaders Conference, being held Monday, May 12 – Wednesday, May 14 at the Hilton Washington DC National Mall The Wharf. In two and a half days, your field leaders will hear from inspiring industry speakers and participate in powerful collaboration, leaving them inspired and re-energized. Don’t miss this opportunity to register your field leaders today.
As a business owner in the mechanical contracting industry, you already juggle enough—projects, workforce management, regulations, and keeping up with an ever-changing market. But what happens in Washington, D.C. directly impacts your bottom line. The CEA National Issues Conference is your chance to influence the policies affecting your business, rather than just reacting to them after they’re set. This is your chance to shape the future of the mechanical contracting industry. Don’t just watch the change—be part of it. Register today!
As part of its ongoing commitment to protecting your livelihood and setting the stage for a bright future, MCAA has secured the services of Longbow Public Policy Group to advise our MCAA Government Affairs Committee (GAC). GAC Chair, Jim Gaffney will be passing along information relative to our industry on a regular basis.

Heather Roberts is the MCA of New Jersey, Inc.’s new Office Manager. Her many years of experience working with unions and union members as a Medical Claims Supervisor for a Union Benefit Funds Administrator prepared her for the role. As she puts it, “I feel at home again at MCANJ.”
MCAA’s web-based labor estimating manual is an invaluable tool for your business. Free as a benefit of your membership.
WebLEM
Scholarships are just one way the John R. Gentille Foundation is investing in your industry’s future. Have you invested in it?
JRGF
You can make an impact on the future of your industry and your business by contributing to the MCAA Political Action Committee.
MCAA PAC
Looking for an intern? You can head to our improved student chapter website and check out the great resumes there!
MCAAGreatFutures
The year-round involvement of our manufacturer/supplier members is part of what makes MCAA special. Learn more about the Council and the value it brings to MCAA.


