Featured Resources

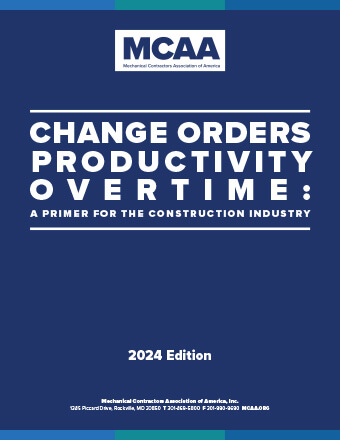
Change Orders, Productivity, Overtime—A Primer for the Construction Industry
This planning tool helps you determine the costs associated with unplanned events, circumstances and factors that may impact the outcome, productivity and schedule of construction projects. New for 2024: a chapter exploring the factors that contribute to BIM cost and time overruns.
Mental Health Awareness & Suicide Prevention Video
Our newest safety and health video highlights the success story of an industry veteran, with appearances from MCAA’s president Robert Beck, the UA’s Jen Massey, industry expert Dr. Sally Spencer Thomas, and MCAA member Ricky Reams.

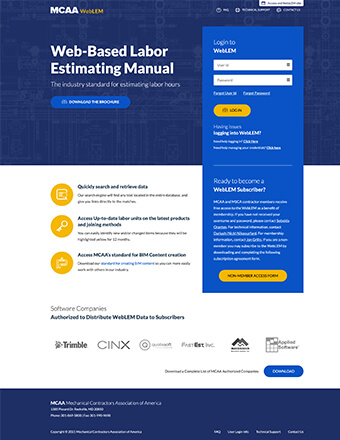
WebLEM is the industry’s most reliable authority for comprehensive labor units for typical project tasks. Quickly search for and retrieve information. WebLEM is reviewed and updated to reflect the latest products and joining methods. You will need your MCAA.org username and password to log in to WebLEM. For WebLEM access questions, please refer to the WebLEM Access FAQs page.

National Service and Maintenance Agreement
The National Service and Maintenance Agreement is an agreement negotiated and administered by the United Association of Journeymen and Apprentices of the Plumbing and Pipefitting Industry (UA) and the Mechanical Service Contractors of America (MSCA) and is a signed contract between the UA and individual mechanical service contracting firms who apply and qualify. The Agreement is a nationally recognized tool that helps contractors provide quality, consistent service to their customers throughout the country and helps reclaim lost market share.
Field leaders looking to enhance their leadership skills and industry knowledge will benefit from MCAA’s May Field Leaders Conference, being held Monday, May 12 – Wednesday, May 14 at the Hilton Washington DC National Mall The Wharf. The event is nearing full capacity. Don’t miss this opportunity to register your field leaders today!
Welcome to Inside MCAA, The Blueprint to Mechanical Contracting, the podcast dedicated to unveiling the strategies and resources that power success within the Mechanical Contractors Association of America. Hosted by renowned Customer Experience Coach and NEI Instructor Frank Favaro, each episode dives deep into the wealth of educational tools, networking opportunities, and advocacy efforts that define MCAA.
New workers are often the most vulnerable to accidents and injuries. MCAA’s New Worker Safety & Health Resources assist contractors in providing training on how to identify common hazards in the mechanical industry, and how to protect themselves from those hazards. Topics covered include stop work authority, pre-task planning, PPE, working at heights, fall protection, fall prevention, power tool safety, hazard communication, housekeeping, and emergency procedures. These are just a few of MCAA’s educational resources that are free to MCAA members as a benefit of membership.
Hurckman Mechanical Industries (HMI), an MCAA member, was awarded the prestigious Wisconsin Workplace Safety Award on April 14, 2025, for medium-sized construction companies. The award was given by the Wisconsin Safety Council (WSC), the state’s leading provider of safety training and products. This honor is a significant achievement—only about 200 companies have received it in the past 31 years.
The Manufacturer/Supplier Training area of MCAA’s website connects our contractor members with training opportunities available from the members of MCAA’s Manufacturer/Supplier Council.
Aidan Wolownik, is studying construction management at Pittsburg State University and is anticipated to graduate this May. Aidan has been a member of the student chapter since 2022 and has held the roles of Fundraising Chair and President. Upon graduation, Aidan will join MCAA Member, Lippert Mechanical Service Corporation as an Assistant Project Manager.
MCAA member contractors and local affiliates are encouraged to participate in an upcoming UA organizing blitz. This is a great opportunity to share the benefits of working for a union contractor and enhance the labor/management relationship. Read on to learn more, then register for a blitz near you.
MCAA’s Virtual Trade Show connects our contractor members with the members of MCAA’s Manufacturer/Supplier Council.
After multiple failed attempts to implement project management software that worked for everyone, McKinstry finally found success with Procore. The customized product from Procore increased efficiency, cut delays, and improved morale. Procore is a benefactor of MCAA25.
There are still plenty of students looking for the perfect summer job. Whether your company is in need of a new project manager, estimator, or a few new interns, posting to the MCAA GreatFutures Job Board is a quick and easy way to attract fresh new talent looking for opportunities across the country. The job board was created to highlight entry level (no experience required) positions in the mechanical contracting industry and is a complimentary resource for MCAA Members.
Field leaders looking to enhance their leadership skills and industry knowledge will benefit from MCAA’s May Field Leaders Conference, being held Monday, May 12 – Wednesday, May 14 at the Hilton Washington DC National Mall The Wharf. The event is nearing full capacity. Don’t miss this opportunity to register your field leaders today!
According to the U.S. Bureau of Labor Statistics (BLS), approximately 15% of the U.S. workforce could be considered lone workers, often working in hazardous environments without direct supervision. Factors such as environments, job duties, and isolation contribute to increased risks for their injury. MCAA and our alliance partners at SMACNA, TAUC and NECA have partnered to assist contractors in enhancing safety for maintenance and repair personnel.
MCAA’s web-based labor estimating manual is an invaluable tool for your business. Free as a benefit of your membership.
WebLEM
Scholarships are just one way the John R. Gentille Foundation is investing in your industry’s future. Have you invested in it?
JRGF
You can make an impact on the future of your industry and your business by contributing to the MCAA Political Action Committee.
MCAA PAC
Looking for an intern? You can head to our improved student chapter website and check out the great resumes there!
MCAAGreatFutures
The year-round involvement of our manufacturer/supplier members is part of what makes MCAA special. Learn more about the Council and the value it brings to MCAA.


